 lunabia
Basal body temperature chart: how to read your curve
A temperature chart shows ovulation only after the fact, never before. Once you know how to measure, log it and apply the rule of three over six, you can understand your own cycles far better.
What the chart actually shows
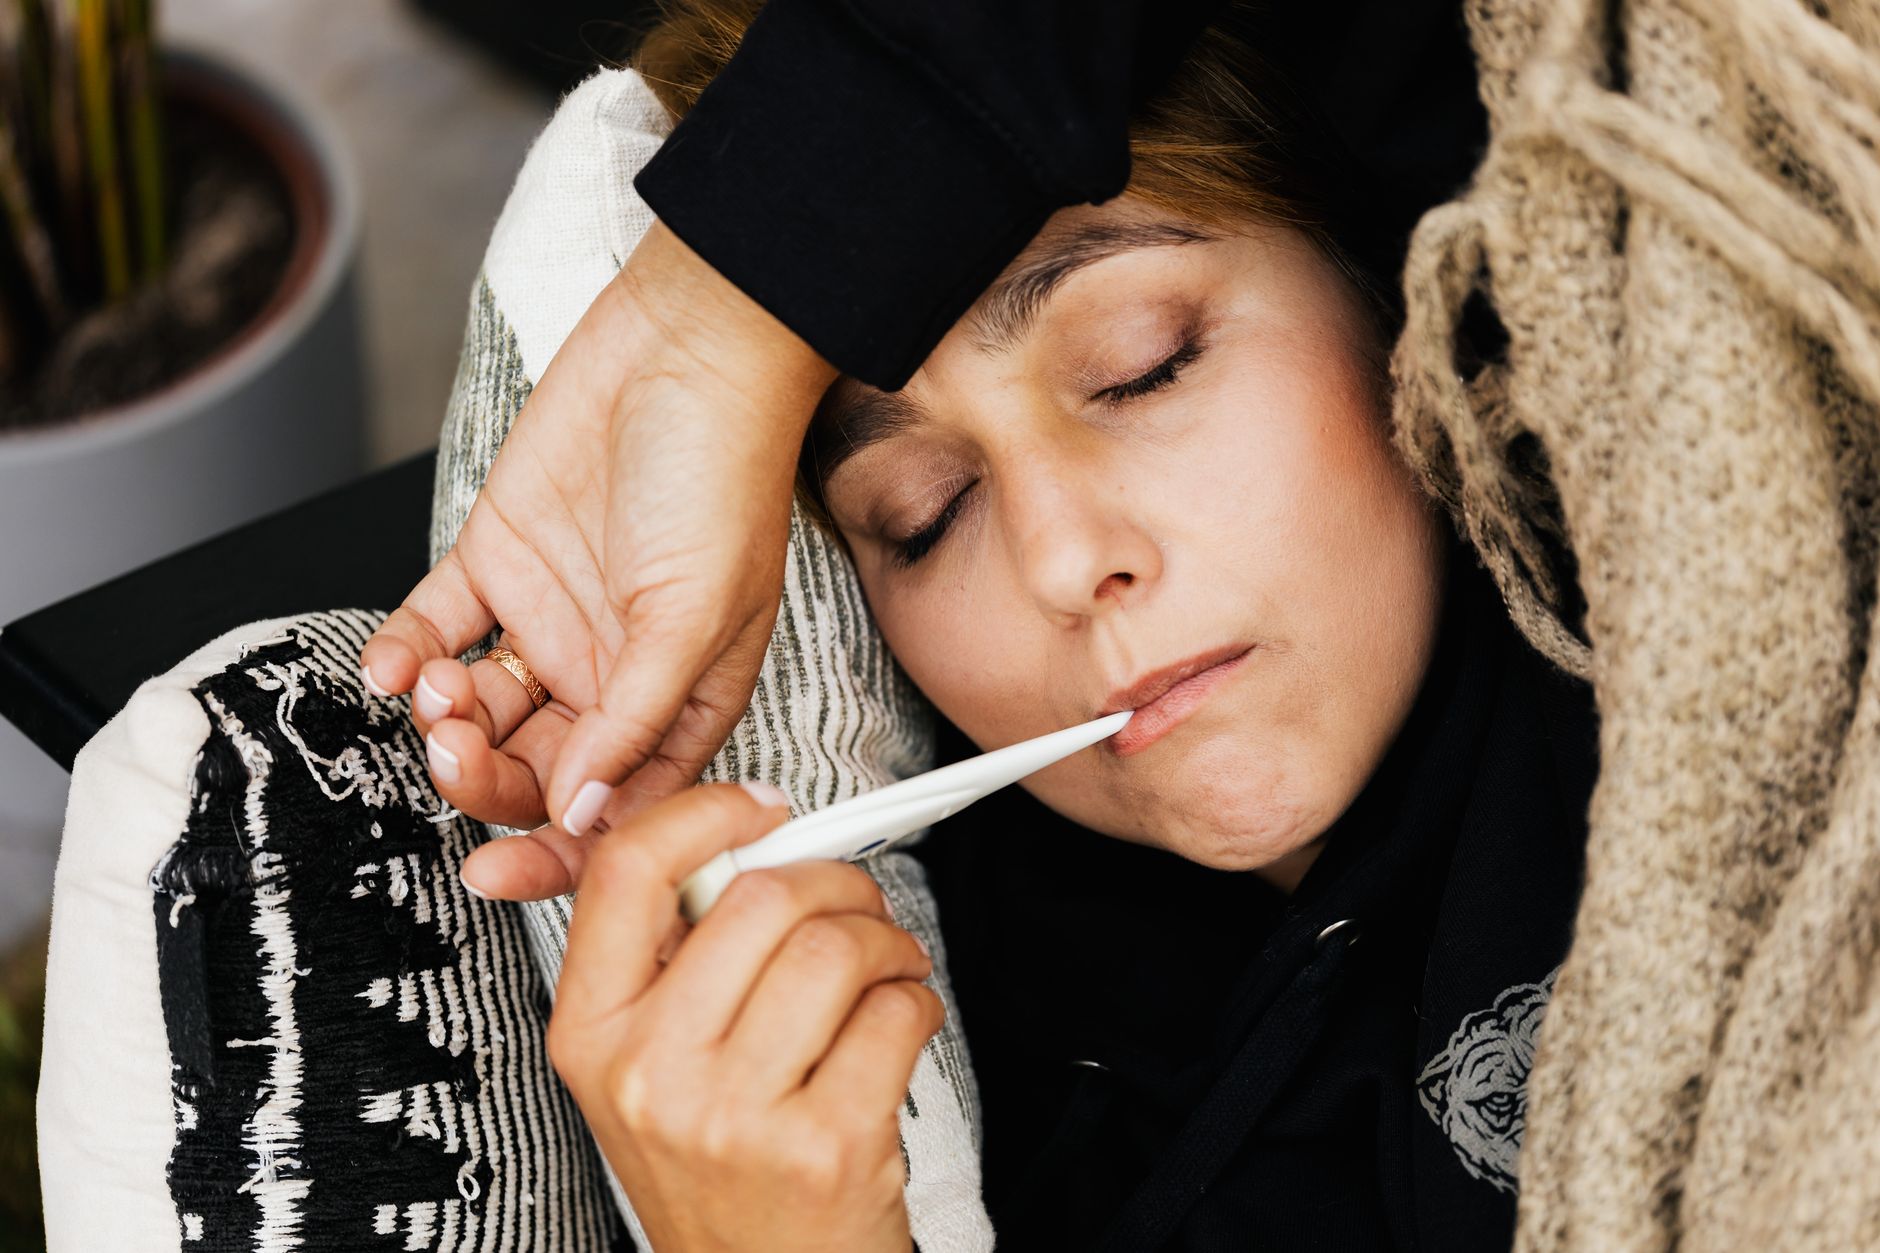
Basal body temperature is your body's temperature at complete rest, taken right after waking up, before you get up, speak, or even properly open your eyes. During the first half of the cycle, it sits between 36.2 and 36.5 degrees for most women. After ovulation, the body produces progesterone, and progesterone raises the temperature by about 0.2 to 0.5 degrees. This rise lasts until your next period, or longer if you become pregnant.
Here's the key point: the temperature rises after ovulation has already happened. It shows ovulation in hindsight, not in advance. A chart can tell you that you probably ovulated two or three days ago. It can't tell you that ovulation is coming tomorrow.
Measuring correctly, so the number actually means something
Basal temperature is sensitive. Even half an hour of extra sleep or a conversation before measuring noticeably changes the reading. That's why a few consistent habits help more than an expensive thermometer.
Measure at the same time every day, ideally within an hour of your usual time. Measure at the same site, orally, vaginally, or rectally, and don't switch between them. Use the same thermometer, ideally one with two decimal places, since the differences are small. Keep it within reach on your nightstand so you don't have to get up to fetch it.
You also need at least about three to four hours of uninterrupted sleep beforehand. If you wake up several times a night, for example because you're still breastfeeding a child, your readings will be skewed. That's not a mistake on your part, it's simply a limit of the method itself.
Logging it: consistency matters more than the third decimal place
Log your temperature every day, even if the reading looks odd or you took it under less than ideal conditions. A single outlier barely affects the analysis, but a gap of several days does, because then the shift from low to high becomes hard to spot.
Also note what was different that day: too little sleep, alcohol the night before, a fever, a different time of measurement. These notes often turn out to matter more than the number itself later, because they explain why a particular reading stands out.
The rule of three over six
To spot the shift, you compare the last three readings with the six readings before them. If all three new readings are higher than the highest of the previous six, by at least 0.2 degrees, the temperature rise counts as confirmed. This is the so called rule of three over six, one of the standard evaluation rules of the symptothermal method.
An example makes this clearer:
| Cycle day | Temperature |
|---|---|
| 10 | 36.3 |
| 11 | 36.4 |
| 12 | 36.3 |
| 13 | 36.4 |
| 14 | 36.3 |
| 15 | 36.4 |
| 16 | 36.7 |
| 17 | 36.8 |
| 18 | 36.7 |
The six readings from day 10 to 15 form the baseline, the highest of which is 36.4. The three readings after that are all above 36.6, so more than 0.2 degrees higher. The shift is therefore considered confirmed, retroactively for day 15 or 16.
It's important to remember that a single higher reading proves nothing. Only three consecutive days above the baseline make the rise reliable enough to count as a sign that ovulation has already happened.
Factors that can throw off your chart
Many things raise or lower your temperature without having anything to do with your cycle. Alcohol the evening before often lowers it, a cold coming on or an infection raises it. Shift work with changing sleep times makes the chart unreadable, and so does crossing time zones while travelling. Heavy stress, too little sleep, and certain medications also play a role.
If you're on hormonal contraception, this method won't help you observe your natural cycle anyway, because the hormones from the pill, the patch, or the hormonal IUD mask the natural pattern. And a broken or poorly calibrated thermometer makes even the most careful measuring worthless. If in doubt, it's worth having a second thermometer to cross check.
What the chart shows, and what it doesn't
A clean chart with a clear shift shows that ovulation has probably happened, and roughly when. It doesn't show whether ovulation will happen in this cycle at all before it occurs, and it doesn't show it on the same day. In Lunabia, you log your readings in the cycle calendar, and the app estimates from them when ovulation most likely occurred. That's all it ever is, an estimate based on your own entries, whether in the app or on paper.
For contraception, the temperature chart alone isn't enough, not even combined with an app. The symptothermal method, as used in family planning, combines temperature with other observations like cervical mucus and requires thorough training, usually with a qualified counsellor. If you want to use it for contraception, you need the full method, not a single chart. But if you simply want to understand how your own cycle works, regular measuring and a bit of patience will give you a pretty clear picture of when things are happening in your body.
FAQ
How precisely do I need to measure basal temperature for the analysis to be accurate?
What matters most is consistency: always at the same time, at the same body site, with the same thermometer, right after waking up and before any movement. The exact decimal reading matters less than this consistency.
When does the temperature chart confirm that ovulation has happened?
When the last three readings are all higher than the highest value from the six days before, by at least 0.2 degrees, the shift is considered confirmed under the rule of three over six. This confirms ovulation in hindsight, not in advance.
Can I use basal temperature for contraception?
No, the temperature chart alone isn't enough for that. For contraception you need the complete symptothermal method with additional observations, usually along with professional training, not just a single measurement.
Why does my chart sometimes deviate strongly from my usual pattern?
Common causes include too little sleep, alcohol, an infection starting, travel across time zones, or stress. It's best to make a note of such days rather than deleting them from your chart.
This text does not replace a visit to your doctor or midwife. If something hurts or worries you, call them, even at night.
All posts on this topic: Understanding your cycle